

Jeremy Jamilano, MPH1, Ye Shen, MPH1, Jennifer Ellison, MSc1, and Jenine Leal, PhD1,2,3,4,5
1 Infection Prevention and Control, Alberta Health Services, Alberta, Canada
2 Department of Community Health Sciences, University of Calgary, Alberta, Canada
3 Department of Microbiology, Immunology and Infectious Diseases, University of Calgary, Alberta, Canada
4 O’Brien Institute for Public Health, University of Calgary, Alberta, Canada
5 AMR – One Health Consortium, University of Calgary, Alberta, Canada
Corresponding author:
Jenine Leal, PhD
Research Scientist, Assistant Professor
Infection Prevention and Control,
Departments of Community Health Sciences, Microbiology, Immunology, and Infectious Diseases
Alberta Health Services
University of Calgary
Tel: (403) 973-6918 | email: jenine.leal@albertahealthservices.ca
ABSTRACT
Background: The international emergence of carbapenemase-producing organisms (CPOs) among gram-negative bacteria represents a public health threat. In Canada, CPO rates have been increasing and there is growing concern of CPO reservoirs that may exist outside of hospital settings. The geographic patterns of CPOs were investigated in Alberta, Canada using geographic information systems and spatial analysis was performed to determine the presence of any spatial clusters of CPOs.
Methods: Using multiple healthcare data sources, CPO case information identified in the community and healthcare settings were collected. The CPO cases were analyzed using spatial scan statistics to detect any CPO spatial clusters within the province of Alberta. The identified spatial clusters were stratified based on the collected healthcare data from the surveillance management system.
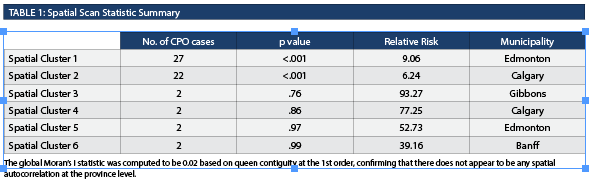
Results: Spatial analysis confirmed two CPO spatial clusters, specifically within the municipalities of Edmonton and Calgary. The spatial cluster in southeast Edmonton had 27 CPO cases with a relative risk of 9.06 (p < .001). The spatial cluster in northeast Calgary had 22 CPO cases with a relative risk of 6.24 (p < .001). The NDM gene was the primary gene type in both spatial clusters and there was a higher proportion of cases that had previous history of travel outside of Alberta without healthcare exposure. The Serratia marcescens enzyme gene was observed to have the second highest proportion in all the CPO cases in the province, however, it was not well represented in either spatial cluster.
Conclusions: The study confirmed spatial patterns of CPO distribution in Alberta. The findings can direct additional studies and may be used to develop community-specific interventions or strategies to prevent the transmission of CPO in Alberta.
KEYWORDS
Geographic information system, carbapenemase-producing organisms, spatial epidemiology
INTRODUCTION
Gram-negative bacteria, such as the Enterobacteriaceae, Pseudomonas sp. and Acinetobacter sp., have developed increasing rates of antibiotic resistance and have contributed to significant hospital-acquired infections (Mehrad et al., 2015). One of the most reliable treatments to treat bacterial infections are carbapenems, which are a class of antibiotics that have a broad spectrum of activity (Codjoe & Donkor, 2017).
The international emergence of carbapenemase-producing organisms (CPO) represents a significant public health threat (Codjoe & Donkor, 2017). CPOs are gram-negative bacteria resistant to carbapenem antibiotics, mediated by the presence of carbapenemase, an inactivating enzyme (Codjoe & Donkor, 2017). The acquisition of a CPO and subsequent infection in patients causes significant morbidity and mortality rates between 24-70% (Codjoe & Donkor, 2017). In Canada, the rate of CPO colonization in both the hospital and community settings have increased since 2014 from 0.03 colonizations per 10,000 patient days to 0.14 in 2017, representing a five-fold increase (Public Health Agency of Canada [PHAC], 2019). The Public Health Agency of Canada hypothesizes that the increased rate may be attributed to increased awareness, changes to screening practices, true increases in colonized cases, including transmission within Canada, or a combination of these factors (PHAC, 2019). The majority of CPO acquisition has been attributed to healthcare exposure abroad or international travel to high-risk countries (Codjoe & Donkor, 2017; Kohler et al., 2018). Although international travel remains a significant risk factor, there is evidence that a growing portion of CPO acquisition is occurring with no epidemiolocal link to inpatient healthcare exposures or hospital CPO outbreaks (Bulens et al., 2022; Mataseje et al., 2016). In Canada, there is a growing proportion of CPO cases that have no international travel or encounters with healthcare abroad, suggesting an acquisition of CPOs within the country (Kohler et al., 2018). It is important to recognize the potential of CPO reservoirs that exist outside of hospital settings.
In Alberta, CPO surveillance data showed that more than half of the new CPO cases identified were in the community or upon presentation to a hospital, highlighting the potential of CPO acquisition prior to their encounter at a healthcare facility (Shen et al., 2020). Given the increase of CPO transmission in Canada and the growing concern of transmission outside of the hospital setting, investigating the spatial distribution of CPO cases can inform if there are spatial clusters of CPOs in the community. The investigation of disease clustering is a branch of spatial epidemiology that assesses the local accumulation of a specific disease to generate hypotheses about disease causation (Rezaeian et al., 2007). The use of geographic information system (GIS) has been used to map spatial clusters of antibiotic resistant organisms in the environment (Chique et al., 2019; Shaw & McGuire, 2017). The goal of this project was to describe the geographic patterns of CPOs in Alberta using GIS.
METHODS
Study design and population
A retrospective study was conducted to explore the geographic patterns of CPOs among individuals residing in Alberta, Canada between April 1, 2013 to March 31, 2018. This project was approved by the University of Calgary’s Conjoint Health Research Ethics Board (REB19-2058).
Data source
Cases of CPOs identified in healthcare facilities were provided by the Alberta Health Services Infection Prevention & Control Surveillance and Standards team (AHS IPC). Province-wide hospital-based surveillance for CPOs began in April 2013 and a surveillance protocol outlined the methodology for reviewing CPO cases (Alberta Health Services Infection Prevention and Control, 2023). In hospital, CPO screening was performed if a patient had a healthcare admission or received hemodialysis for more than 24 hours outside of Canada in the past six months or if epidemiological investigations were being performed. Laboratory confirmed CPO cases identified in healthcare facilities are documented in a provincial online surveillance management system and all cases were included in this study. Data elements for each CPO case included: Personal Health Number (PHN), sex, CPO case classification (hospital-acquired, hospital-identified, on-admission), infection status and gene type. Additional risk factor information was collected based on the CPO surveillance protocol (Alberta Health Services Infection Prevention and Control, 2023) to understand the epidemiology in Alberta and the determination of the presence of any travel outside of Alberta either with or without healthcare exposure, epidemiological link to current or previous healthcare facility within 12 months or within the community, residency in a long-term care facility, presence of an invasive device and any history of renal dialysis or surgery in the past year.
CPO case classifications are defined below and are adjudicated by an Infection Control Practitioner (IPC) (Alberta Health Services Infection Prevention and Control, 2023):
Hospital acquired – Initial CPO-identified case believed to be epidemiologically linked to another person(s) with a CPO infection or colonization in the current facility or specimen collection date of the initial CPO occurs during a hospital admission within 12 months of an epidemiological link in a previous admission to any healthcare facility.
Hospital identified – Initial CPO-identified case on or after the third calendar day of admission with no known CPO colonization or infection at time of admission and no established epidemiological link to another person(s) with a CPO infection or colonization for the same organism at the current facility or any healthcare facility in the 12 months prior to specimen collection date.
On admission – Initial CPO on the day of admission (calendar day 1) and/or the day after admission (day 2) not meeting case definitions for hospital-acquired or hospital-identified and no established epidemiological link to another person(s) with a CPO infection or colonization at the current facility or any healthcare in the 12 months prior to specimen collection date.
In community – Any CPO case identified in the community healthcare setting and not initially identified in a healthcare facility performing CPO surveillance.
Cases of CPOs identified in the community were provided to AHS IPC by Alberta Health and Alberta Precision laboratories – Public Health Laboratory. Data elements for each community CPO case included PHN, collection date, gene type, and sex.
The extracted PHNs were submitted by AHS IPC to Alberta Precision Laboratories to retrieve six-digit postal code information for each CPO case, which was associated to their place of residence at the time of CPO identification. CPO cases that had a postal code outside of Alberta or did not have an assigned postal code were excluded from spatial analysis. The AHS IPC team removed PHNs and assigned anonymous identifiers prior to providing data to the project team for analysis.
Map construction
The province of Alberta has been defined by Statistics Canada into geographical boundaries known as dissemination areas (DA), which are the smallest stable geographic unit that census data is disseminated to and represent an average population of 400-700 persons. The base map (shapefile) was based on the 2016 census DAs in Alberta and represented 5803 area units. Population data for each DA was obtained through population census data (Statistics Canada, 2018). The shapefile with the base map of Alberta is publicly available and was accessed through the Government of Alberta Open Data Resources (Government of Alberta, 2022).
The six-digit postal code information for each CPO case was geocoded to geographical latitude and longitude coordinates using a Canada Postal Address Database. The geocoded cases were then assigned to their respective DA in Alberta.
ArcMap (version 10.4.1) was used for data management and mapping and to study the distribution of the CPO cases across Alberta. All case identifiers, such as the PHN, postal code and associated geographical coordinates were removed during the analysis.
Spatial statistical analysis
Exploratory spatial data analyses were conducted and included assessing for spatial autocorrelation and spatial clustering. The Global Moran’s I determined the presence of spatial autocorrelation based on the CPO rates per 10,000 population assigned to each DA across the entire study area using the GeoDa (1.14.0 24) software. The value of Moran’s I can range from -1 to +1, where -1 indicates high values tend to associate with lower values (dispersion) and +1 indicates high values associate with high values (spatial clustering). At 0, the distribution is randomly distributed. A spatial weight matrix was created using queen-based contiguity, where DA neighbours were defined by those sharing common boundaries and vertices.
Spatial clustering was identified using SaTScan (v9.6) and employed Kulldorf’s spatial scan statistic. This statistic can detect whether observed events are randomly distributed or if there is evidence of spatial clustering in a geographical area. It employs a maximum likelihood ratio test statistic based on a circular scanning window of variable sizes for the entire geographical area under review. Three data files were created for SaTScan: number of CPO cases in each DA of Alberta, population data of each DA and geographical coordinates (longitude, latitude) for the centroid location of each DA.
From the confirmed spatial clusters, SaTScan calculated the risk of CPOs within the spatial cluster in relation to the rest of the study region to determine the relative risk (RR). Population census data and the number of CPO cases were used to determine the risk of each spatial cluster. The statistical significance of any cluster was reviewed by using Monte Carlo replication greater than 999 to ensure confidence of any presenting spatial clusters.
The identification of any spatial cluster was stratified based on: sex, CPO classification, infection status, gene type and risk factors collected within the provincial online surveillance management system. The z-score test was applied against identified spatial clusters and the total CPO dataset to identify any statistically significant differences from the observed proportions. The Bonferroni correction was used to mitigate type I errors from conducting multiple statistical tests across the proportions (Armstrong, 2014).
RESULTS
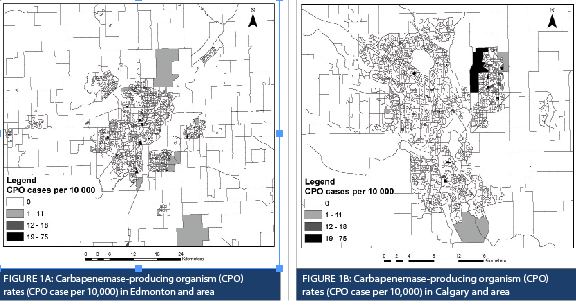
There were 171 CPO cases in Alberta between April 1, 2013 and March 31, 2018. Ten cases were excluded from spatial analysis due to the absence of postal code information. From all the obtained postal code information, over 80% of the CPO cases were in Edmonton and Calgary. Population census data were used to generate CPO rates for each DA, which are represented by varying sizes and shapes outlined in black (Figure 1A and 1B). Spatial scan statistics identified six spatial clusters within Alberta (Table 1).
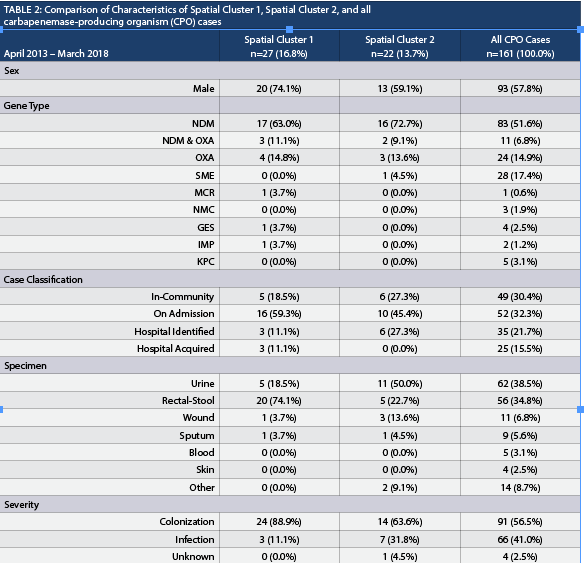
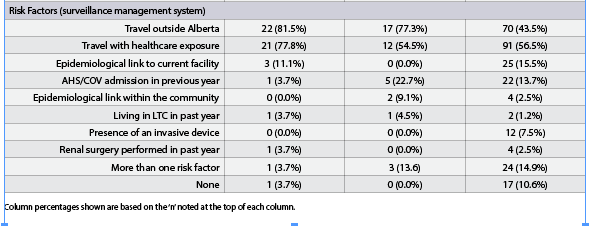
Spatial Cluster 1, Spatial Cluster 2, and all CPO cases were compared (Table 2). When comparing Spatial Cluster 1 vs. all CPO cases, Spatial Cluster 2 vs. all CPO cases and Spatial Cluster 1 vs. Spatial Cluster 2, most characteristics yielded non-significant results except for rectal-stool comparison between Spatial Cluster 1 and Spatial Cluster 2. The number of rectal-stool specimens was significantly greater in Spatial Cluster 1 than in Spatial Cluster 2. The New Delhi metallo-β-lactamase (NDM) gene represented the highest proportion identified in all the CPO cases in the province and in both spatial clusters. The Serratia marcescens enzyme (SME) gene represented the second highest proportion in all the CPO cases (17.4%, 28/161), however, it was not well represented in Spatial Cluster 1 (0.0%, 0/27) or Spatial Cluster 2 (4.5%, 1/22). The CPO cases with the SME gene were randomly distributed in Alberta, where a majority were identified in Edmonton. There were no differences when the proportion of different gene types and the proportion of classifications were compared. The proportion of rectal-stool specimens in Spatial Cluster 1 (74.1%, 20/27) was higher than Spatial Cluster 2 (22.7%, 5/22) and was statistically significant when adjusting for the Bonferroni correction. The CPO cases identified in Spatial Cluster 2 were primarily through urine specimens (50.0%, 11/22), but was not statistically different than Spatial Cluster 1 (18.5%, 5/27). The proportion of cases classified as colonization or infection were not statistically different between the clusters or from the total CPO cases. In terms of risk factors collected within the surveillance management system, Spatial Cluster 1 (81.5%, 22/27) and Spatial Cluster 2 (77.3%, 17/22) had a higher proportion of cases that travelled outside of Alberta, and both were statistically different in contrast to the total CPO cases (43.5%, 70/161) identified in the province. None of the four CPO cases identified with an epidemiological link within the community were from the same household.
DISCUSSION
This study represents the first application of GIS to explore the distribution pattern of CPO with the intent of detecting any CPO spatial clusters in Alberta. Over the five-year study period, CPO cases were confirmed in all five health zones of the province. When using the DA as the areal unit of measure, spatial autocorrelation was low across the province highlighting the absence of any spatial patterns of CPO cases when considering the province. Performing spatial analysis confirmed two CPO spatial clusters in distinct geographical areas in the municipalities of Edmonton and Calgary. Stratification of each spatial cluster was based on the data collected through the provincial surveillance protocol. The CPO gene type in all the CPO cases and in the spatial clusters were mainly composed of the NDM gene type. This is not consistent with the findings across Canada, where Klebsiella pneumoniae carbapenemases (KPC) were reported as the predominant gene type followed by NDM (Canadian Nosocomial Infection Surveillance Program, 2022).
In contrast to the characteristics of all the CPO cases in the province, the two spatial clusters demonstrated an amplification of the proportion of cases that had a previous history of travel outside of Alberta without healthcare exposure prior to CPO acquisition. International CPO epidemiological data has shown that KPC, NDM and oxacillin beta-lactamase (OXA) genes are endemic in certain countries such as the United States, Pakistan and Turkey, respectively (Tilahun et al., 2021). The travel destination of each case was not captured in healthcare or community data collection processes but travel abroad to endemic countries has been associated with the importation of CPO into non-endemic countries and is acknowledged as a potential source of CPO and outbreaks (Savard & Perl, 2014).
Additionally, long-term care facilities have been associated with high CPO colonization and have the potential to act as a continuous reservoir for the transmission within acute care health facilities (Savard & Perl, 2014). This relationship was not observed in the confirmed spatial clusters or the total CPO cases based on the risk factor data collected within the provincial online surveillance management system.
The findings of the spatial analysis confirmed that the distribution of CPO is not completely random. Spatial autocorrelation refers to the tendency for observations of close spatial proximity to share similarities in contrast to observations further apart (Tobler, 1970). This measure is based on Tobler’s first law of geography which states: “everything is related to everything else, but nearby objects are more related than distant objects” (Tobler, 1970).
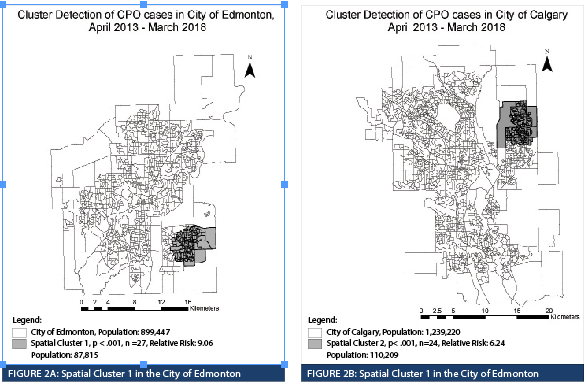
Two CPO spatial clusters in the Edmonton and Calgary areas were identified with elevated relative risk in specific geographical areas of each municipality. The spatial clusters do not suggest CPO transmission within the DAs but highlights geography as a community risk factor that can be further investigated using population census data at the DA level to identify potential sociodemographic factors associated with the incidence of CPO. Sociodemographic factors have been reviewed for other organisms of interest using GIS. Spatial analysis of community acquired (CA) methicillin-resistant Staphylococcus aureus (MRSA) infections in Calgary identified that most cases were concentrated in the downtown area (Gill et al., 2019). Those who were English speaking, identified as visible minority Chinese or South Asian, and had a high median household income had a decreased relative risk of CA-MRSA infections (Gill et al., 2019). Spatial analysis of Clostridioides difficile identified associations with ethnicity, socioeconomic disadvantage, and proximity to nursing homes or livestock farms (Anderson et al., 2017; Lal et al., 2020). The identification of associated sociodemographic factors can be applied to community health profiling to generate specific interventions to improve overall health in the community.
Future research opportunities exist in the application of wastewater surveillance. The concentration of CPO cases in spatial clusters in Alberta are based on CPO cases that have been exclusively identified from those who have received diagnostic testing in hospital and healthcare community settings. Implementing wastewater surveillance is valuable because it has the capability to act as an indicator of infectious diseases independent from those accessing healthcare and therefore the potential to reveal additional information about the distribution of a disease (Kilaru et al., 2022). To further investigate the distribution of CPO cases across a population, wastewater surveillance has been shown to be an efficient tool to supplement hospital and community surveillance data (Blaak, 2021). In the Netherlands, a wastewater surveillance program was implemented and identified an unexpected widespread distribution CPO across all Dutch provinces, whereas the standing interpretation of laboratory surveillance data described the distribution of CPO as sporadic and related to hospital outbreaks (Blaak, 2021). In Alberta, healthcare-based surveillance data has acknowledged the potential of a growing CPO reservoir outside of the hospital setting (Shen et al., 2020). Wastewater surveillance may be a potential tool to aid in describing the distribution of CPO across the province based on the defined service areas of the water treatment facilities.
This study design was exploratory in nature and represents a limitation, in which hypotheses can only be generated from its findings. The risk factors identified from provincial hospital-based surveillance cannot be applied to DAs at the population level since they were only representative of the cases identified.
A limitation of GIS in disease mapping is the statistical bias effect known as the modifiable areal unit problem. This effect is produced when data is aggregated onto geographical units that have been bound by arbitrary boundaries and the population within the area is assumed to be homogenously distributed (Keeler & Michael, 2017). The conversion of the postal code to geographical coordinates, particularly in the rural area, may not be located within the boundaries of a specific DA and fall into multiple DA boundaries and could impact the analysis. Majority of the CPO cases were identified in urban areas and none of the cases within the identified spatial clusters were assigned to multiple DAs. The DA resolution was too high to observe data at the population level. Using larger or other standardized geographical units may produce observable data at the population level but may yield different spatial analysis results. Although data at the provincial level was not produced visually, the entire province was reviewed using the defined methodology. The strength of spatial autocorrelation at the province level was expected to be low considering that 98.3% of the DAs in the province did not have any CPO cases observed, resulting in a very high distribution of DAs with a CPO rate of 0. Defining a local study area, such as the Edmonton or Calgary, or using larger geographical units would have produced stronger spatial autocorrelation results considering that over 80% of the total CPO cases were identified in these municipalities.
There are significant public health implications of the acquisition and transmission of CPO and identifying the distribution of cases can assist in understanding its spatial epidemiology. The application of GIS on CPO surveillance data has confirmed spatial patterns of CPO distribution in Alberta, specifically in Edmonton and Calgary. Contributing factors, such as socio-demographics at the population level, were not within the scope of the project but the findings can direct further investigations. Additional studies may be used to develop community-specific interventions or strategies to prevent the transmission of CPO in Alberta.
REFERENCES
Alberta Health Services Infection Prevention and Control. (2023). Carbapenemase-producing Organisms (CPO) Protocol. https://www.albertahealthservices.ca/assets/healthinfo/ipc/hi-ipc-sr-cpo-surveillance-protocol.pdf.
Anderson, D. J., Rojas, L. F., Watson, S., Knelson, L. P., Pruitt, S., Lewis, S. S., Moehring, R. W., Sickbert Bennett, E. E., Weber, D. J., Chen, L. F., Sexton, D. J., & CDC Prevention Epicenters Program. (2017). Identification of novel risk factors for community-acquired Clostridium difficile infection using spatial statistics and geographic information system analyses. PloS One, 12(5). https://doi.org/10.1371/journal.pone.0176285.
Armstrong R. A. (2014). When to use the Bonferroni correction. Ophthalmic & physiological optics: Journal of the British College of Ophthalmic Opticians (Optometrists), 34(5), 502–508. https://doi.org/10.1111/opo.
Blaak, H., Kemper, M.A., Man, H.D., Leuken, J.P., Schijven, J.F., Passel, M.W., Schmitt, H., & Husman, A.M. (2021). Nationwide surveillance reveals frequent detection of carbapenemase-producing Enterobacterales in Dutch municipal wastewater. Science of The Total Environment, 776. https://doi.org/10.1016/j.scitotenv.2021.145925.
Bulens, S. N., Reses, H. E., Ansari, U. A., Karlsson, Frass, J. E., Carmon, C., Albrecht, V., Laswsin, A., McAllister, G., Daniels, J., Lee, Y., Yi, S., See, I., Jacob, J. T., Bower, C. W., Wilson, L, Vaeth, E., Lynfield, R., Vagnone, P. S., Shaw, K., Walters, M. S. (2022). Carbapenem-Resistant enterobacterales in individuals with and without health care risk factors —Emerging infections program, United States, 2012-2015. American Journal of Infection Control, 51(1), 70-77.
https://doi.org/10.1016/j.ajic.2022.04.003.
Canadian Nosocomial Infection Surveillance Program. (2022, August 3). Healthcare-associated infections and antimicrobial resistance in Canadian acute care hospitals, 2016 to 2020. Retrieved April 16, 2023, from https://www.canada.ca/en/public-health/services/reports-publications/canada-communicable-disease-report-ccdr/monthly-issue/2022-48/issue-7-8-july-august-2022/healthcare-associated-infections-antimicrobial-resistance-canadian-acute-care-hospitals-2016-2020.html.
Chique, C., Cullinan, J., Hooban, B., & Morris, D. (2019). Mapping and Analysing Potential Sources and Transmission Routes of Antimicrobial Resistant Organisms in the Environment using Geographic Information Systems-An Exploratory Study. Antibiotics (Basel, Switzerland), 8(1), 16. https://doi.org/10.3390/antibiotics8010016.
Codjoe, F., & Donkor, E. (2017). Carbapenem Resistance: A Review. Medical Science (Basel, Switzerland), 6(1), 1. https://doi.org/10.3390/medsci6010001.
Gill, V. C., Ma, I., Guo, M., Gregson, D. B., Naugler, C., & Church, D. L. (2019). Sociodemographic and geospatial associations with community-associated methicillin-resistant Staphylococcus aureus (CA-MRSA) infections in a large Canadian city: an 11-year retrospective study. BMC Public Health, 19(1), 914. https://doi.org/10.1186/s12889-019-7169-3.
Government of Alberta. (2022, June 11). Federal Dissemination Area – Alberta [shapefile]. Retrieved from https://open.alberta.ca/opendata//e8783419-9c28-4361-9281-5100402b50ae.
Keeler, C., & Michael, E. (2017). Geographic Information Systems (GIS) in Public Health. (S.R., Quah, Ed.). Academic Press. https://doi.org/10.1016/B978-0-12-803678-5.00174-0.
Kilaru, P., Hill, D., Anderson, K., Collins, M., Green, H., Kmush, B., & Larsen, D. (2022). Wastewater Surveillance for Infectious Disease: A Systematic Review. American Journal of Epidemiology, 192(2). https://doi.org/10.1093/aje/kwac175.
Kohler, P. P., Melano, R. G., Patel, S. N., Shafinaz, S., Faheem, A., Coleman, B. L., Green, K., Armstrong, I., Almohri, H., Borgia, S., Borgundvaag, E., Johnstone, J., Katz, K., Lam, F., Muller, M. P., Powis, J., Poutanen, S. M., Richardson, D., Rebbapragada, A., Sarabia, A., Toronto Invasive Bacterial Diseases Network (TIBDN). (2018). Emergence of Carbapenemase-Producing Enterobacteriaceae, South-Central Ontario, Canada. Emerging Infectious Diseases, 24(9), 1674–1682. https://doi.org/10.3201/eid2409.180164.
Lal, A., Swaminathan, A., & Holani, T. (2020). Spatial clusters of Clostridium difficile infection and an association with neighbourhood socio-economic disadvantage in the Australian Capital Territory, 2004-2014. Infection, Disease & Health, 25(1), 3–10. https://doi.org/10.1016/j.idh.2019.08.002.
Mataseje, L. F., Abdesselam, K., Vachon, J., Mitchel, R., Bryce, E., Roscoe, D., Boyd, D. A., Embree, J., Katz, K., Kibsey, P., Simor, A. E., Taylor, G., Turgeon, N., Langley, J., Gravel, D., Amaratunga, K., & Mulvey, M. R. (2016). Results from the Canadian Nosocomial Infection Surveillance Program on Carbapenemase-Producing Enterobacteriaceae, 2010 to 2014. Antimicrobial Agents and Chemotherapy, 60(11), 6787–6794. https://doi.org/10.1128/AAC.01359-16.
Mehrad, B., Clark, N., Zhanel, G., & Lynch, J. (2015). Antimicrobial Resistance in Hospital-Acquired Gram-Negative Bacterial Infections. Chest, 147:1413-1421. https://doi.org/10.1378/chest.14-2171.
Public Health Agency of Canada. (2019, April 30). Canadian Antimicrobial Resistance Surveillance System – Update 2018: Executive Summary. Retrieved from https://www.canada.ca/en/public-health/services/publications/drugs-health-products/canadian-antimicrobial-resistance-surveillance-system-2018-report-executive-summary.html.
Rezaeian, M., Dunn, G., St. Leger, S., & Appleby, L. (2007). Geographical epidemiology, spatial analysis and geographical information systems: a multidisciplinary glossary. Journal of Epidemiology & Community Health, 61, 98-102.
http://dx.doi.org/10.1136/jech.2005.043117.
Savard, P., & Perl, T. M. (2014). Combating the spread of carbapenemases in Enterobacteriaceae: a battle that infection prevention should not lose. Clinical Microbiology and Infection, 20(9), 854–861. https://doi.org/10.1111/1469-0691.12748.
Shaw, N., & McGuire, S. (2017). Understanding the use of geographical information systems (GIS) in health informatics research: A review. Journal of Innovation in Health Informatics, 24(2), 940. https://doi.org/10.14236/jhi.v24i2.940.
Shen, Y., Ellison, J., Chandran, U., Fathima, S., Kanji, J., Lee, B., . . . Bush, K. (2020). A 6-Year Review of Carbapenemase-Producing Organisms in Alberta, Canada. Infection Control & Hospital Epidemiology, 41(S1), S104-S105. doi:10.1017/ice.2020.608.
Statistics Canada. (2018, February 7). Population and Dwelling Count Highlight Tables, 2016 Census. Retrieved from https://www12.statcan.gc.ca/census-recensement/2016/dp-pd/hlt-fst/pd-pl/Table.cfm?Lang=Eng&T=1701&SR=1&S=9&O=A&RPP=25&PR=48&CMA=0&CSD=0.
Statistics Canada. (2019, January 3). Dictionary, Census of Population, Dissemination Area (DA). Retrieved from https://www12.statcan.gc.ca/census-recensement/2016/ref/dict/geo021-eng.cfm.
Tilahun, M., Kassa Y., Gedefie A., & Ashagire M. (2021). Emerging Carbapenem-Resistant Enterobacteriaceae Infection, Its Epidemiology and Novel Treatment Options: A Review. Infection and Drug Resistance, 14(4363-4374). https://doi.org/10.2147/IDR.S337611.
Tobler, W. (1970). A Computer Movie Simulating Urban Growth in the Detroit Region. Economic Geography, 46(234–240). https://doi.org/10.2307/143141.